
Most sales teams measure more than they manage. They track activity volume, pipeline value, deal count, win rate, time-to-close, and average deal size simultaneously — and end up with dashboards that describe what happened without telling anyone what to do differently. The KPIs that actually matter are the ones that predict revenue before it appears in the numbers.
The distinction between leading and lagging KPIs is not academic. Leading indicators give you time to intervene; lagging indicators tell you what already happened. Building your sales measurement framework around lagging outcomes and then wondering why performance is inconsistent is one of the most common and expensive mistakes in sales management.
Leading vs Lagging Sales KPIs: What the Difference Means in Practice
A lagging KPI is an outcome: quota attainment, revenue closed, win rate. A leading KPI is a behaviour or event that reliably precedes the outcome: number of discovery calls, pipeline-to-quota ratio, proposal acceptance rate. Sales managers who focus exclusively on lagging indicators are always reacting. Those who measure leading indicators can course-correct while there is still time.
The same logic applies to hiring. The 5 Cs of Sales Success — Communication, Confidence, Customer Focus, Closing, and Consistency — are leading indicators of sales performance. Hiring against them before the first quarter begins is more predictive than reviewing quota attainment after the fact.
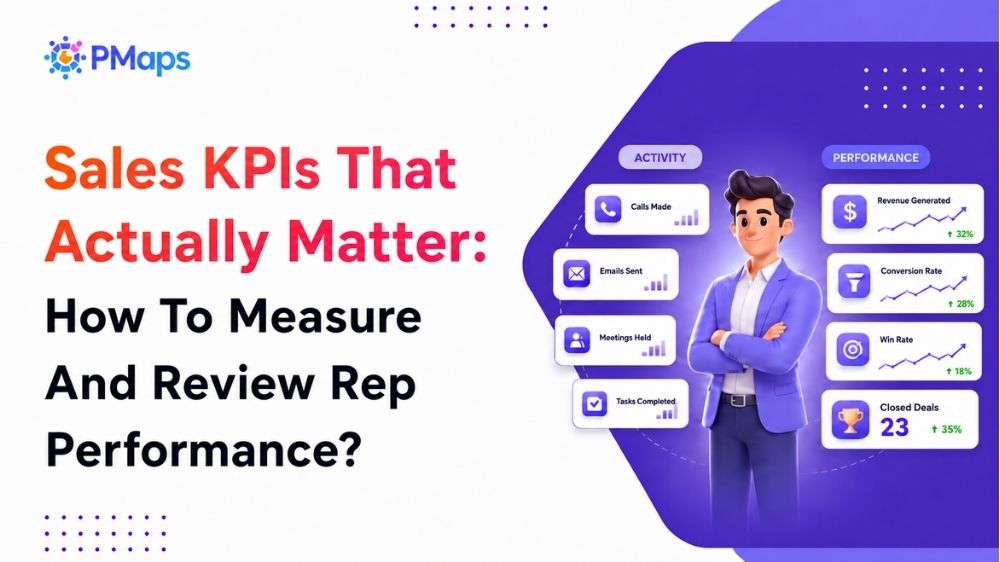
The Sales KPIs That Actually Predict Performance
Call-to-Meeting Conversion Rate
This is the most direct measure of communication quality and opener effectiveness. If a rep books one meeting from every ten calls, that is a 10% conversion rate. A rep who books three from ten has a structural advantage that compounds across every week of pipeline generation. Call-to-meeting rate is a leading KPI because it shows up in the data two to three weeks before any revenue consequence appears. It is also the KPI most directly linked to verbal communication skill — the first of the 5 Cs.
Pipeline-to-Quota Ratio
A sales rep should carry three to four times their quarterly quota in active pipeline, depending on their average win rate. A rep sitting at 1.5x pipeline with a 25% win rate cannot make quota regardless of effort. Tracking this ratio weekly surfaces coverage gaps before they become missed quarters. It is the leading indicator most directly tied to prospecting consistency — the fifth C.
Proposal Acceptance Rate
Of the proposals a rep sends, what percentage advance to serious negotiation? A low acceptance rate points to one of three problems: misqualification earlier in the funnel, poor proposal quality, or a mismatch between what was sold in discovery and what was presented in the proposal. Each cause has a different fix — but you can only find it if you are tracking the metric.
Win Rate by Stage
Overall win rate is a lagging number. Win rate by stage is a leading one. If your team advances deals from initial meeting to discovery at 80% but drops to 30% at proposal stage, the problem is between those two points. Stage-level win rates pinpoint where value is being lost in the sales process — and which individual reps have stage-specific deficits that training can address.
Average Sales Cycle Length
A rep whose deals take twice as long to close as the team average is either misqualifying, under-closing, or working in the wrong segment. Average sales cycle length, tracked per rep and per deal type, identifies pipeline drag before it turns into a performance review conversation. It is the KPI most directly linked to closing skill and deal control.
Quota Attainment Distribution
The single most important lagging KPI is not average quota attainment — it is the distribution. A team where 20% of reps hit 150% of quota and 60% miss tells you something very different about the health of the sales team than one where 80% of reps hit between 90% and 110%. High attainment concentration means the team is structurally dependent on a few top performers, which creates enormous risk. Quota attainment distribution is the outcome that all your leading KPIs are trying to predict and prevent.
What quota distribution reveals about your hiring process. When fewer than half your sales hires hit target within six months, the problem is usually upstream — in how candidates are screened before they join, not in how they are managed after. PMaps Sales Readiness Assessment identifies competency gaps before hire so quota distribution becomes a reflection of deliberate hiring rather than hiring luck.
The KPIs Most Teams Track That Tell You Very Little
Activity volume — calls made, emails sent, LinkedIn messages — is the most commonly tracked and least predictive leading KPI in most sales environments. A rep who makes 80 calls a week with 6% call-to-meeting conversion will outperform a rep who makes 120 calls at 2%. Volume without quality is a measurement trap: it creates the appearance of effort visibility without actually predicting revenue outcomes. Track activity by conversion rate, not by count.
Revenue per rep is similarly misleading as a primary KPI. It conflates territory quality, tenure, and actual selling skill into a single number that tells you nothing about what is replicable and what is not. Break it down: revenue per rep per segment, revenue per rep per stage of tenure, revenue per rep in comparable territories. That is where the signal is.
When sales performance data reveals consistent gaps in specific competencies across your team, a structured Sales Readiness Assessment can identify whether those gaps are structural hiring issues, training needs, or territory and process problems — before another quarter passes.
How to Build a KPI Framework That Drives Behaviour
A KPI framework should be built backwards from the outcome. Start with the quota target, work back to the pipeline coverage required, then calculate the activity volume needed to build that pipeline at your team’s current conversion rates. That gives you three numbers per rep per week: a pipeline target, a conversation target, and an activity target. Those three numbers, tracked weekly and reviewed in one-to-ones, replace ten metrics with three that actually drive action.
Closing Words
The question is not how many KPIs you track — it is whether the ones you track change what your team does on Monday morning. If a sales manager looks at the dashboard on Friday and cannot identify one specific behaviour to adjust in the following week, the dashboard is not doing its job. Which KPI in your current framework most directly predicts whether a rep will hit their number next quarter?
Want to build a sales team whose leading indicators are already strong at hire? Write to ssawant@pmaps.in or call +91 8591320212.