.webp)
.webp)


.webp)
Leadership Readiness, Measured — Not Guessed
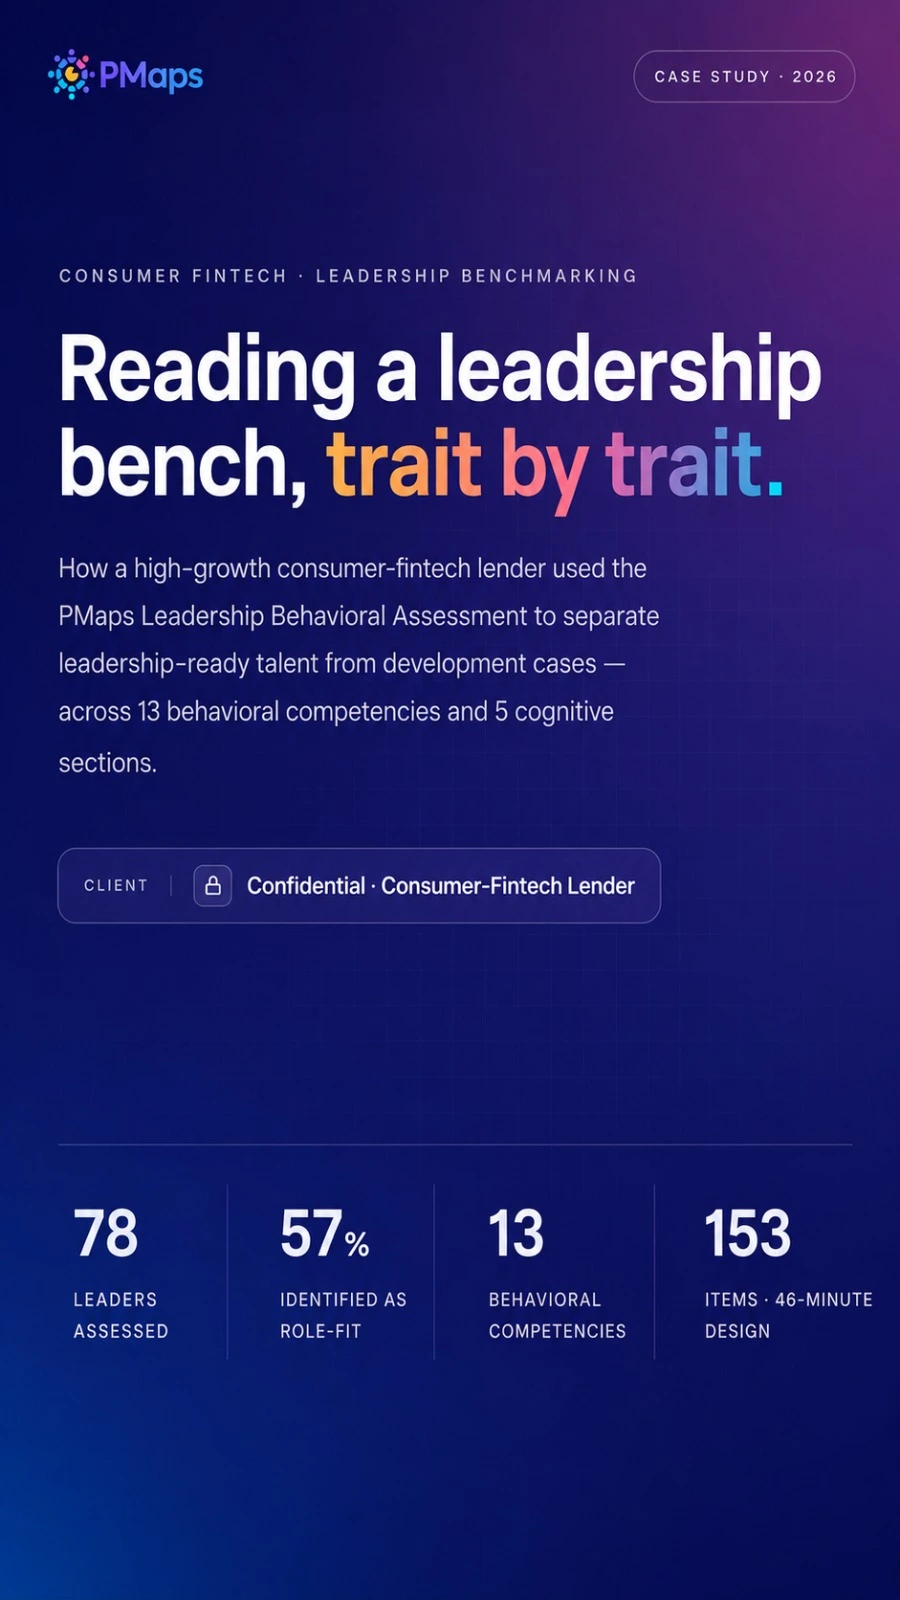
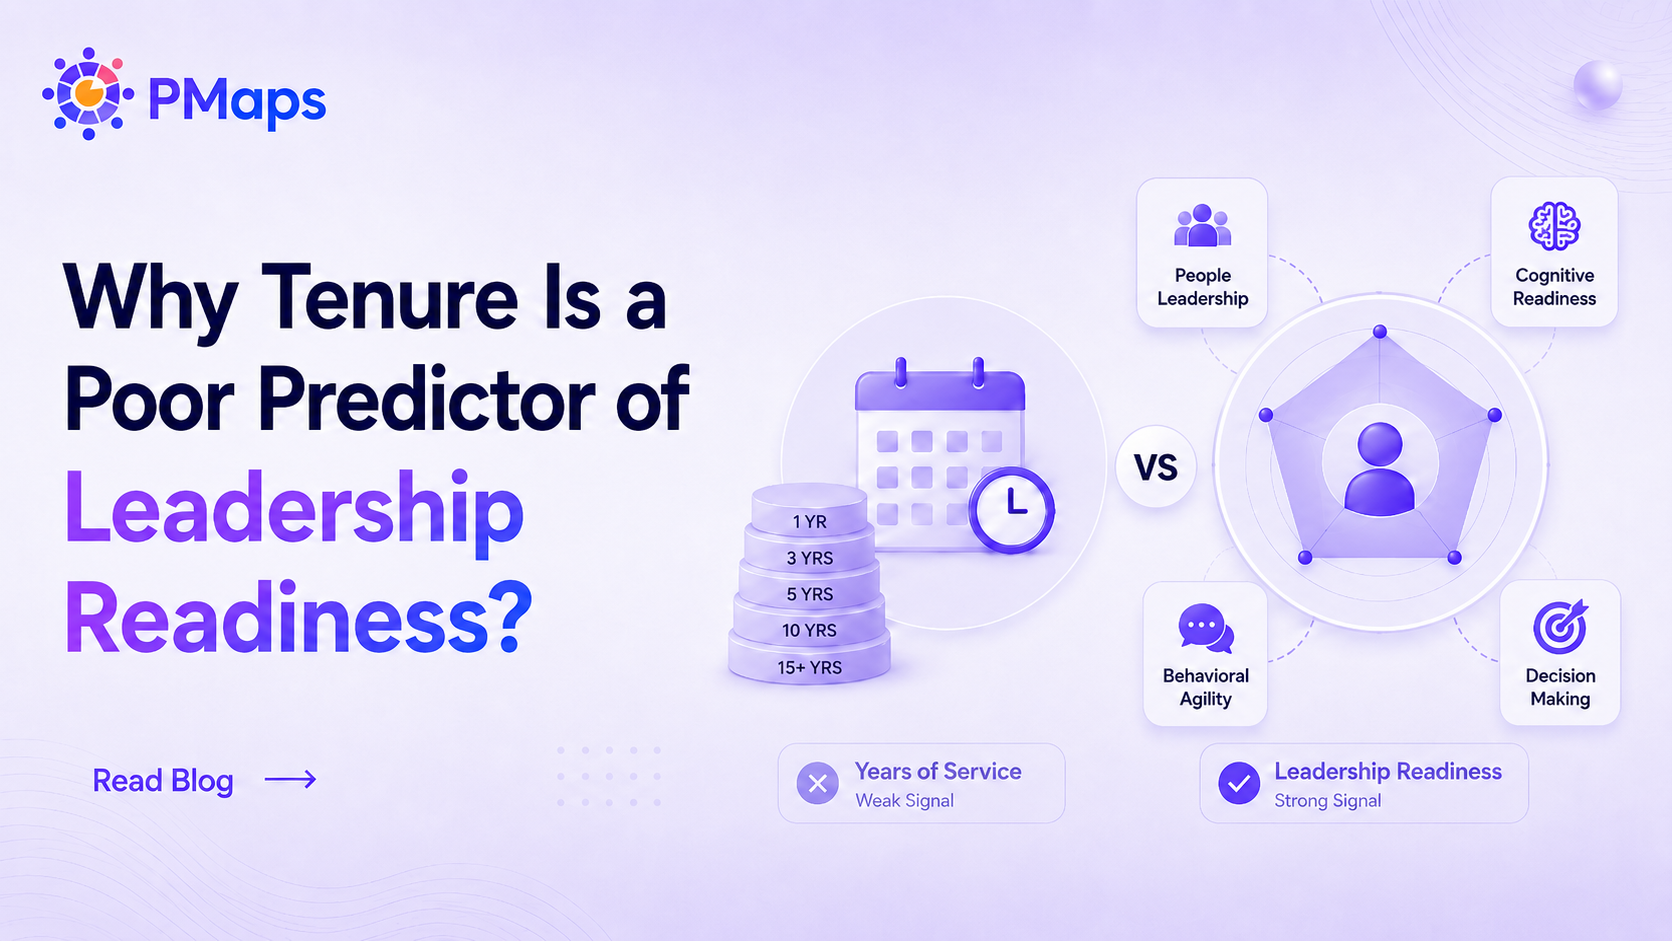
A high-growth consumer-fintech lender had a leadership bench that looked strong on paper: senior, credentialed, long-tenured. But hyper-growth demanded a sharper question than tenure could answer which of these leaders actually carry the behavioral and cognitive profile to scale the business, and which need targeted development?
Promotion and succession were running on opinion. There was no common benchmark to measure leaders against, and no objective view of where to invest in coaching. With the leadership bar rising fast, the client needed evidence, not lengthy interview panels.
One instrument, behavioral core plus cognition
PMaps deployed a custom Leadership Behavioral Assessment: a 128-item behavioral core benchmarked at 60%, paired with five short cognitive sections Quantitative Aptitude, Logical Reasoning, Verbal Ability, General Intelligence, and Attention to Detail benchmarked at 40%. In total, 153 items in a 46-minute design, delivered remotely so every leader took the same assessment under the same conditions: no panel variance, no scheduling drag.
The behavioral core scored each leader across 13 leadership competencies Self Management, Sociability, Empathetic Outlook, Collaboration Skills, Conflict Management, Problem Solving, Open-mindedness, Trusting Others, People Management, Accountability, Self Confidence, Achievement Orientation, and Work Ethics. Behavior shows how a leader operates with people; cognition shows how they handle complexity. The assessment scored both, then blended them into a single, benchmark-referenced read per leader.
A 57/43 split, and what divides it
78 senior leaders were assessed; 77 produced clean, complete responses (one zero-attempt response was excluded). Against the benchmark, 57% qualified as role-fit and 43% were flagged for development. The cohort's average test score was 66%.
The patterns separating the two groups were consistent and actionable:
- Where fit leaders excelled: Quantitative Aptitude — cleaner numerical reasoning under time pressure.
- Where unfit leaders struggled: Collaboration Skills — the clearest weak spot, and the priority area for coaching.
- Engagement gap: fit leaders completed 99% of the assessment versus 86% for unfit leaders.
- Efficiency edge: fit leaders finished the full test in 30.6 minutes on average versus 34.2 for unfit leaders, and the behavioral core in 19.5 minutes versus 22.3.
Read as a signal, the completion gap and the speed edge point to fit leaders being more confident and decisive — engagement that mirrored their scores.
A seasoned bench, so the gaps are real
This wasn't a junior cohort. 95% had 10+ years of experience, 71% were post-graduates, and the average age was 42. Because the bench was uniformly senior, the 57/43 split reflects genuine behavioral and cognitive differences — not gaps in experience or credentials. That's what made the read usable for succession, promotion, and development decisions.
Is this you?
This case study will resonate if:
- Your leadership pipeline is judged on tenure and titles, not measured signal.
- Promotion and succession calls are running on opinion and panel impressions.
- You're scaling fast and need to know who's ready now versus who needs coaching first.
- You want one objective benchmark applied to every leader, free of bias.
One standardized assessment turned a senior, hard-to-read leadership bench into a clear picture: who's ready, who needs development, and exactly where. Behavior and cognition, scored to a benchmark — objective evidence for succession, promotion, and coaching.
Book a 30-minute leadership benchmarking walkthrough →
Note on methodology:
Benchmarks — 60% on the 128-item behavioral core, 40% on the five cognitive sections. Cohort of 78 assessed, 77 clean responses analyzed. Fit/unfit determined by performance against benchmark across both dimensions.